views
Choosing a Science Fair Project
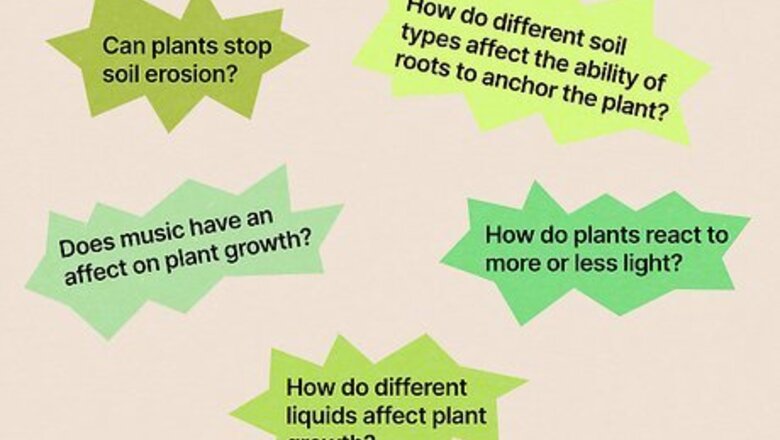
Prepare yourself for the project. Discuss possible topics and plans with your teacher. Note any guidelines they give for the assignment, and keep these requirements in mind while designing your project. If your teacher hands out any worksheets regarding the science fair, keep them together in a folder.
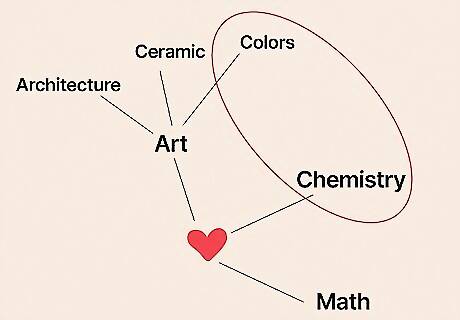
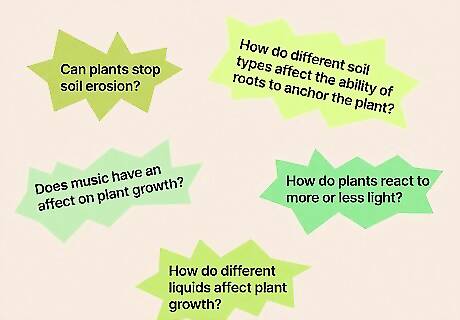
Research topics that interest you. Sometimes people limit themselves to strictly scientific pursuits that might not interest you. When you think about it, everything is in the science field. For example, if you love art, you could research how the chemicals in paint react or how artificial colors are made. After researching, pick the topic that interests you most. Do some brainstorming. Write down any ideas you have or problems that you’d like to solve. Pick a topic that is appropriate for your age level. It’s okay to be ambitious, but make sure you have enough time to finish everything by the deadline. Keep track of all of your sources so you can cite them in your final report.
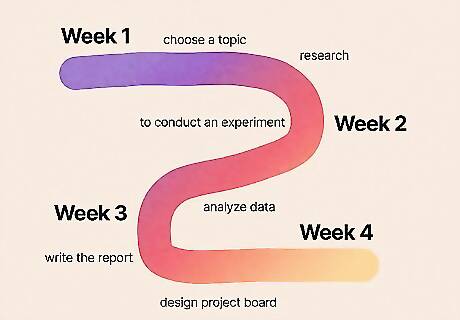
Make a timeline for completion. A crucial part of planning your science fair project is knowing how much time you have to complete it and how much time it will take to research, execute, and write a report about your project. Some experiments may go quickly, but others may take multiple weeks. If you need to talk to an expert, make sure you contact them as soon as possible so you can get on their schedule in time. Spend at least 1 week researching your topic and gathering information. Spend another week analyzing data, writing the report, and designing the board. Choose an experiment that fits within your time constraints. Some experiments can take at least 1 week, including gathering materials.

Write the background research plan. Use your background to generate questions you can answer with a properly designed experiment. The background is essential to properly designing your experiment and understanding how and why the experiment can answer the question you are asking. If you will need to use any mathematical formulas or equations to answer your question, research these as well so that you understand them before you begin. Research experiments that may have already addressed some aspect of your question. Designing the experiment will be easier if you have a previous framework to build upon. Ask your teacher or a parent to help you better understand the topic you’ve chosen by asking them if it looks like you have any gaps in your knowledge.
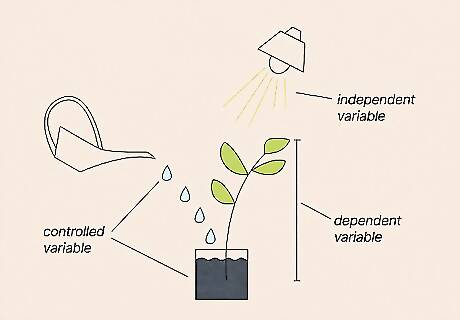
Identify the independent, dependent, and controlled variables. A variable is a condition in the experiment that can occur in varying amounts. When designing an experiment, it is important to identify all of the variables before you begin. To properly examine a cause and effect relationship, you only want one variable to change while everything else remains constant. The independent variable is the condition that the scientist changes. You should only have 1 independent variable. The dependent variable is the condition that's measured in response to the changes in the independent variable. It's the one that gets observed throughout the experiment. The controlled variables are all of the conditions in an experiment that remain constant throughout the duration of the experiment.
Performing the Experiment

Make a hypothesis. A hypothesis is a testable statement about a scientific process and the way it works that is made based on a researched topic. It is usually phrased in an “If this, then that” statement. For example, in an experiment about the growth height of a plant in different light levels, your hypothesis might be: If plants need light to grow, then they will not grow as high in low light or no light conditions.
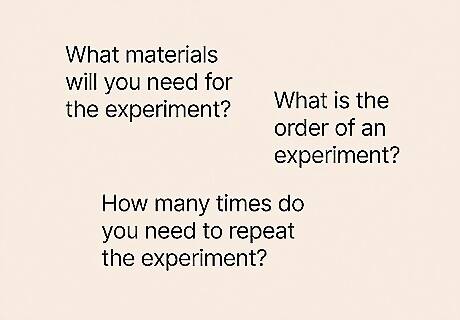
Design your experiment. Once you have chosen a topic and made a hypothesis, you need to design an experiment that will properly test that hypothesis. Remember that you will need to conduct the experiment several times throughout the project to ensure the results are accurate. Consider things such as, how will you answer your question? What materials will you need for the experiment? Is there a specific order in which you need to do everything before it will work? How many times do you need to repeat the experiment before you start to see a pattern in the results? Answering these questions will help you make a materials list and develop a clear procedure. Make sure your experiment can be performed safely or with adult supervision.
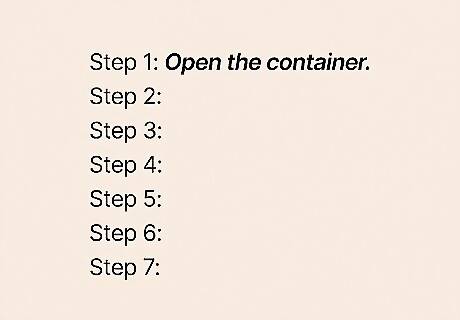
Write a procedure. The procedure is a step-by-step list that details everything you need to do to answer your scientific question. A proper procedure should allow someone to duplicate your experiment exactly without asking any questions. Each step should be clear and only require one action. If a step requires too many things, it should be broken up into multiple steps. Write the steps with an action verb at the beginning, such as “Open the container.” Avoid statements such as, “I opened the container.” Let a parent, sibling, or classmate read your procedure and see if they have any questions. Add more steps if necessary.
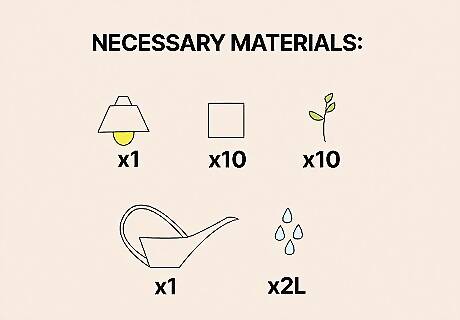
Gather the necessary materials. Look over your procedure and determine what items you will need to execute the experiment. Make the list very detailed so you aren’t in the middle of an experiment when you realize you’re missing something important. If an item is particularly cheap or fragile, you might want to gather extras just in case you need them. Take all of the necessary safety precautions before starting the experiment.
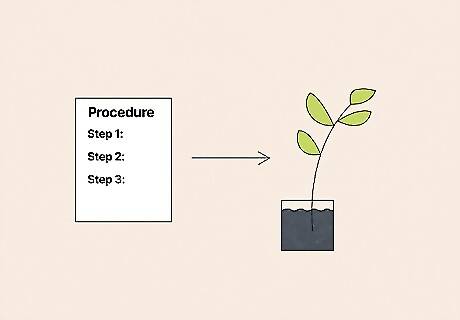
Perform the experiment. Follow your detailed procedure to actually do the experiment. Prepare as much as you can beforehand and have all of your materials nearby so you can get to them when you need them. Have your lab notebook on hand so you can make observations and take notes during the process. Make a note if you altered the procedure in any way during the actual experiment. Take pictures during the experiment to use on your display board.
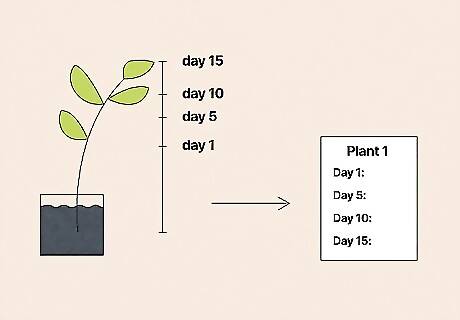
Record observations during the experiment. Write down all of your observations and results as you go along. If you have a short experiment, keep good notes on exactly what you did and what results you obtained. Not all experiments can be completed the same day. If you are doing a long-term experiment, like growing plants, make daily observations about the plants and how they’re changing. Keep all of your observations and data in your lab notebook. For long-term experiments, date each observation so you know exactly when you made it.
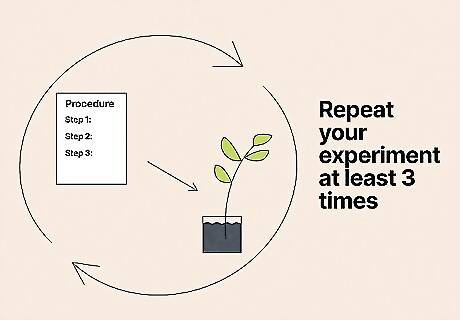
Repeat the experiment. There can be a lot of variability that occurs during an experiment. To account for this variability, scientists perform the same experiment multiple times and average the data of each trial together. Repeat your experiment at least 3 times. If you are doing a multi-day experiment, use multiple replicates in 1 experiment. For example, start an experiment with 3 plants in different light conditions. Use plants with the same starting height or just subtract the original height at the end.
Analyzing the Data
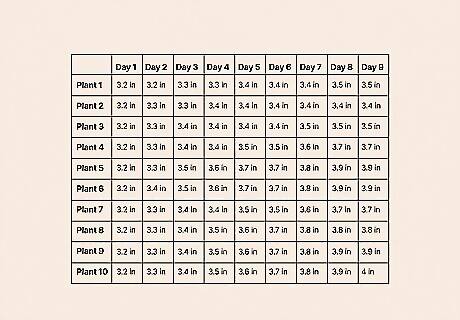
Review the data you have collected to see if it is complete. Did you forget to do something? Did you make any mistakes during the process? Have you done multiple trials of each experiment? If you made mistakes, repeat the procedure until you can do it perfectly. If you are confident in your data, it is time to decipher it and draw some conclusions. You might be able to glance at your data and see if it supports or disproves your hypothesis, but understand that you can’t make any firm conclusions until the data has been properly analyzed.
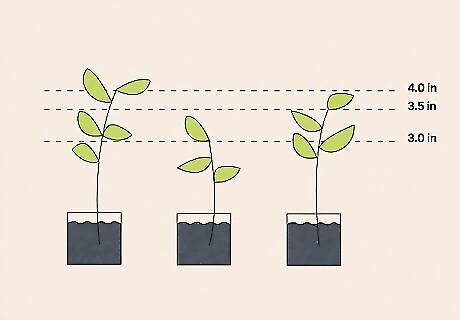
Average multiple trials together. A properly designed experiment will have replicates or multiple trials. You may have performed the experiment multiple times or you may have tested multiple items at the same time (example: tested battery length of 3 batteries from each brand or tested growth of 3 of the same plant under multiple growing conditions). The data from each of these replicates need to be averaged together and will represent one data point for that condition. To average the trials, add each trial together and then divide by the number of trials. For example, your 3 plants in low light may have grown 3.0 inches (7.6 cm), 4.0 inches (10 cm), and 3.5 inches (8.9 cm), respectively. The average growth height for low light is (3+4+3.5)/3 = 3.5 in.
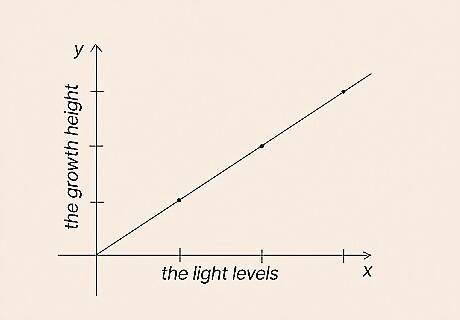
Make a table or graph to represent your data. Oftentimes, it is easier to see differences in the data when you make a visual graph. Generally, the independent variable is plotted on the x-axis (horizontal) and the dependent variable is on the y-axis (vertical). Bar graphs and line graphs are a great way to visualize your data. You can draw a graph by hand, but it looks much cleaner and more professional to make it on the computer. For our example, graph the light levels on the x-axis and the growth height on the y-axis.
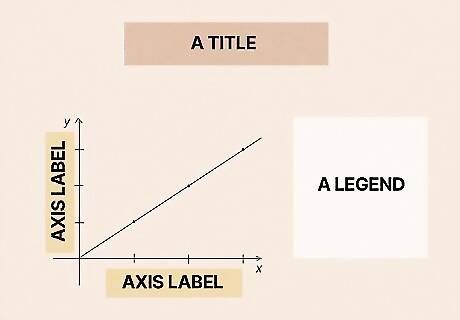
Label everything on the graph. Give the graph a title and label the x-axis and y-axis. Be sure to include the proper units used (hrs, ft, in, days, etc). If you have multiple data sets on one graph, use a different symbol or color to represent them. Put a legend on the right side of the graph to identify what each symbol and color represents. Give the graph a title that tells you exactly which data are represented. For example, “Plant Growth Height in Various Levels of Light.”
Draw a conclusion. Now that you have plotted your data, you should be able to easily see differences between your various conditions. At the elementary and middle school level, you can draw your conclusions simply by looking at the data. State whether the data support or disprove the hypothesis. Discuss changes you might make to the procedure or future studies you could do to further the study. At the high school level, you might be able to run some statistics on your data to see if there truly are significant differences between the independent variables.
Presenting Your Project
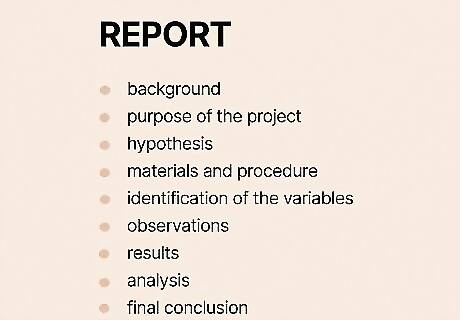
Write your report. Before you start working on the actual display board, you need to put together your report. The report shouldn’t be too difficult because you have written most of the sections during the actual experiment. A full report needs to have a background, the purpose of the project, the hypothesis, the materials and procedure, identification of the variables, your observations, results, analysis, and final conclusion. Some reports may require an abstract, which is just a short summary of the entire project. Proofread your entire report before turning it in. Cite all of the sources used for your report. Do not copy and paste information from sources, but summarize it in your own words.
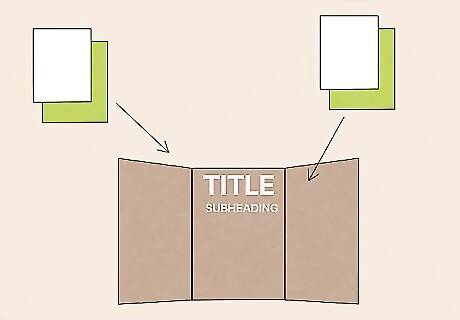
Present the project on a tri-fold display board. The board is where you can get a little creative and make an artistic display of everything you discovered with your experimenting. Pick 1 or 2 bright colors that complement each other to use as an accent. Avoid hand writing the information as this can give your board a messy look. Center the title at the top of the board and use large letters that can be seen from a distance. Make subheadings that are bold and large enough to read at a distance of 2–3 feet (0.61–0.91 m). Too many colors on the board can be overwhelming and look chaotic. Stick to 1 or 2 colors to make everything pop. Print the necessary information on white paper and then layer the colored construction paper underneath. Avoid using wrinkled paper and leaving glue marks on the board. Make sure your fonts and font sizes are consistent throughout each section.
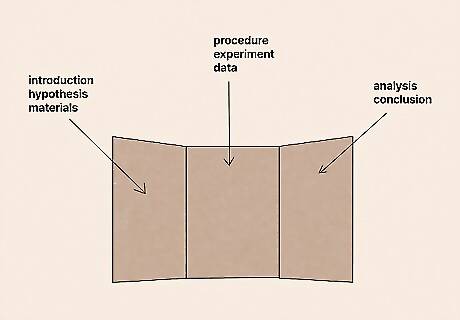
Organize your information on the board logically. Center subheadings above the paragraphs of information. Make sure everything flows together: start with the introduction, hypothesis and materials on the left side, add the procedure, experiment, and data in the center panel, finish with the analysis and conclusion on the right panel. This is a loose guideline to follow. Organize everything so that it looks nice and ordered. Include pictures that were taken during the experiment to show exactly what you did. Avoid using giant blocks of text. If you do have some that are large, break them up with pictures or figures.
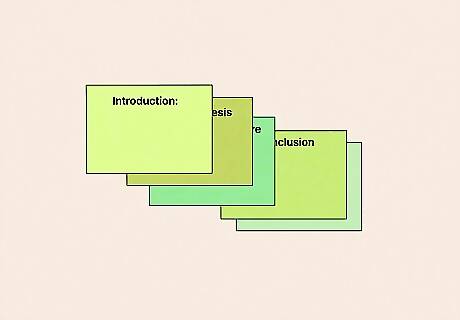
Practice your speech for presenting your project. On the day of the science fair, people will want to hear all about your project and how you did it. Practice what you are going to say in front of friends and family so you won’t be nervous on the day of the presentation. Be prepared to answer questions about your project as well. Write some note cards with key points in case you need to refer back to them when speaking with someone.





Comments
0 comment