views
X
Research source
one of them is to plot the lines of the 2 equations, thus solving the equation. This article will teach you how to solve simultaneous equations graphically!
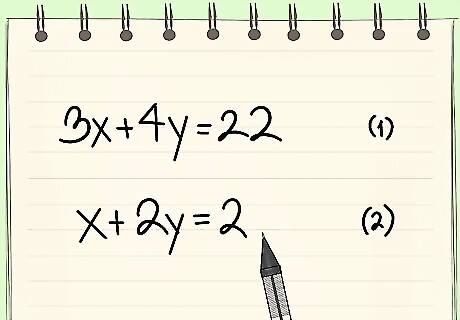
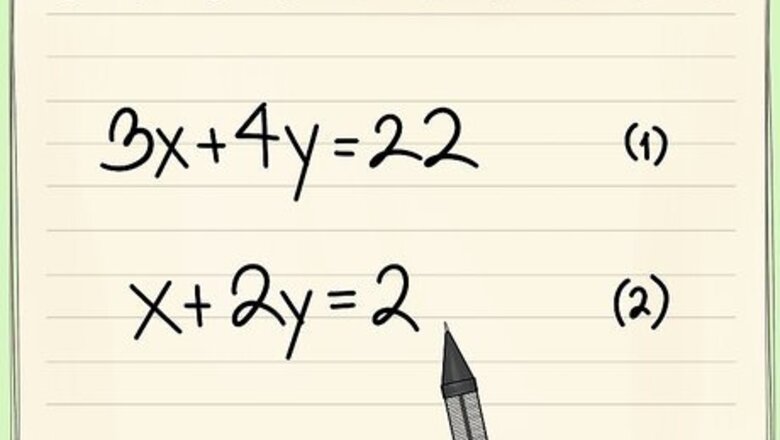
Write your 2 equations clearly. Write your 2 equations in an organised, clear way. This will make it easier later. In this guide, we are going to use equations 3x+4y=22 and x+2y=2 as an example.
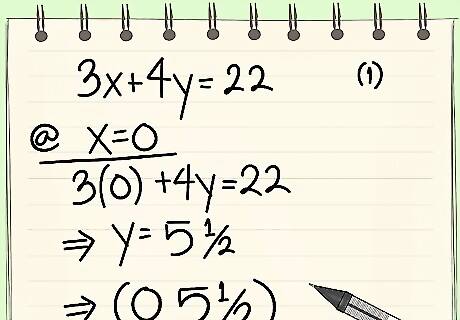
In the first equation, let x be 0. Replace x with 0, and solve the equation. This should give you the value of y. Using the example before: 3*0+4y=22, which becomes 4y=22, and then y=5½ You now have your first coordinate, (0 ; 5½)
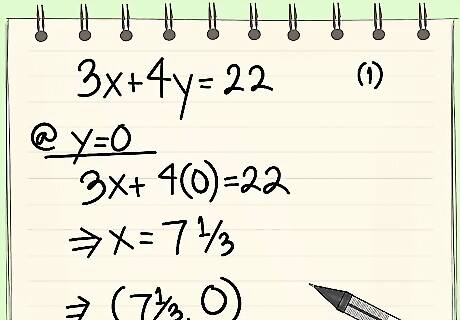
Let y be 0. In the first equation, let y be 0 and solve the equation. This will give you the value of x. Using the example: 3x+4*0=22 which becomes 3x=22 which gives us the answer of x=7⅓ You now have a set of coordinates for your first line, (0 ; 5½) and (7⅓ ; 0)
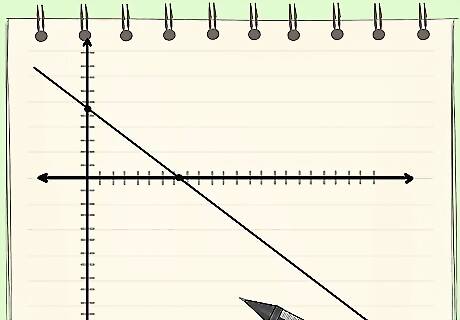
Draw a graph with 4 quadrants. Draw the line of your first equation on it. EXPERT TIP Joseph Meyer Joseph Meyer Math Teacher Joseph Meyer is a High School Math Teacher based in Pittsburgh, Pennsylvania. He is an educator at City Charter High School, where he has been teaching for over 7 years. Joseph is also the founder of Sandbox Math, an online learning community dedicated to helping students succeed in Algebra. His site is set apart by its focus on fostering genuine comprehension through step-by-step understanding (instead of just getting the correct final answer), enabling learners to identify and overcome misunderstandings and confidently take on any test they face. He received his MA in Physics from Case Western Reserve University and his BA in Physics from Baldwin Wallace University. Joseph Meyer Joseph Meyer Math Teacher Develop strong graphing skills. Drawing graphs by hand will help you develop foundational graphing skills, especially in understanding scales and axes. This will build a strong base for you to use helpful online tools to visualize complex relationships, perform calculations, and prepare for standardized tests.
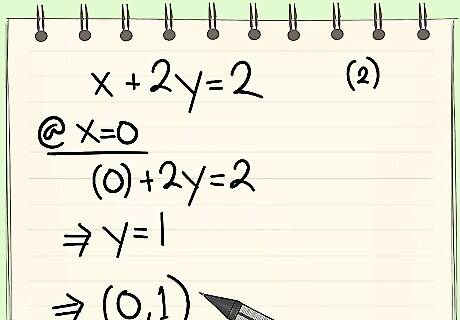
In the second equation, let x be 0. Then solve the equation, giving you the value of y. Using the example, it's 0+2y=2, which becomes 2y=2 and y=1 First coordinate is now (0 ; 1)
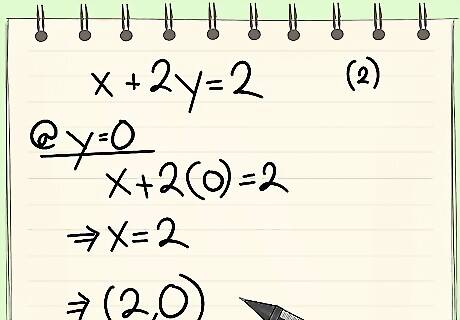
Let y be 0. Solve the equation and get the value of x. Example: x+2*0=2, which becomes x=2. Second coordinate is now (2 ; 0)
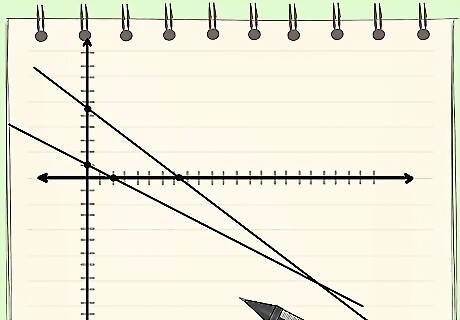
Draw the line of the second equation on the same graph as before. If needed, increase the length of the 2 lines until they meet.
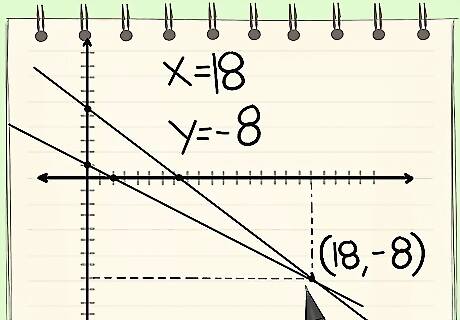
Look at the point in which the 2 lines meet. Get it's coordinates (x ; y). The x coordinate will be the value of x in the equation, and the y coordinate will be the value of y! If you've been using the example, the lines should meet at point (18 ; -8). x will be 18, and y will be -8!




Comments
0 comment