
views
Preparing the Data
Collect your data. Unless you are just completing a math homework assignment, calculating relative frequency generally implies that you have some form of data. Conduct your experiment or study and collect the data. Decide how precisely you wish to report your results. For example, suppose you are collecting data on the ages of people who attend a particular movie. You could decide to collect and report the exact age of everyone who attends. But this is likely to give you 60 or 70 different results, being every number from about 10 through 70 or 80. You may instead wish to collect data in groups, like “Under 20,” “20-29,” “30-39,” “40-49,” “50-59,” and “60 plus.” This would be a more manageable set of six data groups. As another example, a doctor might collect body temperatures of patients on a given day. In this case, just collecting whole numbers, like 97, 98, 99, might not be precise enough. It might be necessary to report data in decimals in this case.
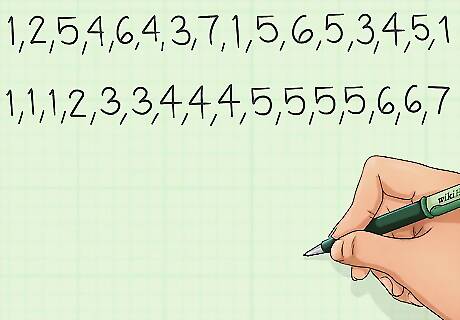
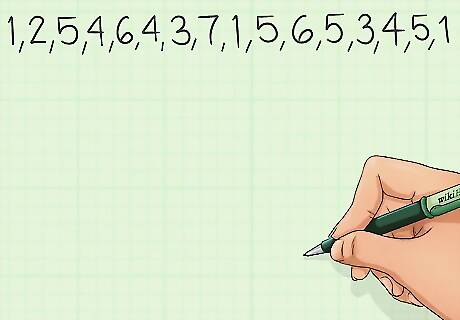
Sort the data. After you complete your study or experiment, you are likely to have a collection of data values that could look like 1, 2, 5, 4, 6, 4, 3, 7, 1, 5, 6, 5, 3, 4, 5, 1. In this form, the data appear almost meaningless and difficult to use. It is more helpful to sort the data in order from lowest to highest. This would result in the list 1,1,1,2,3,3,4,4,4,5,5,5,5,6,6,7. When you are sorting and rewriting your collection of data, be careful to include every point correctly. Count the data set to make sure you do not leave off any values.
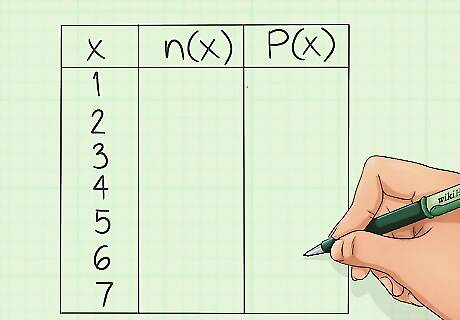
Use a data table. You can summarize the results of your data collection by creating a simple data frequency table. This is a chart with three columns that you will use for your relative frequency calculations. Label the columns as follows: x {\displaystyle x} x. This column will be filled with each value that appears in your data set. Do not repeat items. For example, if the value 4 appears several times in the list, just put 4 {\displaystyle 4} 4 under the x {\displaystyle x} x column once. n {\displaystyle n} n, n ( x ) {\displaystyle n(x)} n(x) or f r ( x ) {\displaystyle fr(x)} fr(x). In statistics, the variable n {\displaystyle n} n is conventionally used to represent the count of a particular value. You may also write n ( x ) {\displaystyle n(x)} n(x), which is read as “n of x,” and means the count of each x-value. A final alternative is f r ( x ) {\displaystyle fr(x)} fr(x), which means the “frequency of x.” In this column, you will put the number of times that the value appears. For example, if the number 4 appears three times, you will place a 3 next to the number 4. Relative Frequency or P ( x ) {\displaystyle P(x)} P(x). This final column is where you will record the relative frequency of each data item or grouping. The label P ( x ) {\displaystyle P(x)} P(x), which is read “P of x,” could mean the probability of x or the percentage of x. The calculation of relative frequency appears below. This column will be used after you complete that calculation for each value of x.
Calculating Relative Frequency Results
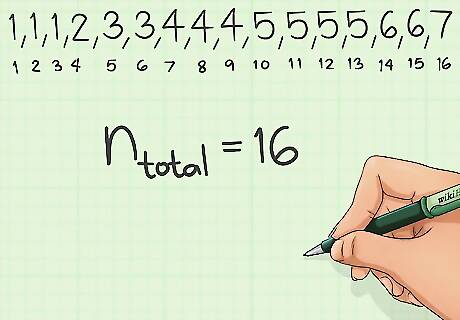
Count your full data set. Relative frequency is a measure of the number of times a particular value results, as a fraction of the full set. In order to calculate relative frequency, you need to know how many data points you have in your full data set. The will become the denominator in the fraction that you use for calculating. In the sample data set provided above, counting each item results in 16 total data points.
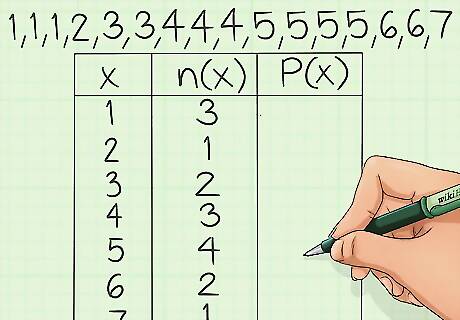
Count each result. You need to determine the number of times that each data point appears in your results. You may want to calculate the relative frequency of one particular item, or you may be summarizing the overall data for the full data set. For example, in the data set provided above, consider the value 4 {\displaystyle 4} 4. This value appears three times in the list.
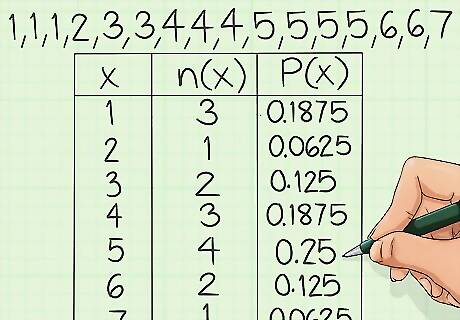
Divide each result by the total size of the set. This is the final calculation to determine the relative frequency of each item. You can set it up as a fraction or use a calculator or spreadsheet to perform the division. Continuing with the example above, because the value 4 {\displaystyle 4} 4 appears three times, and the full set contains 16 items, you can determine that the relative frequency of the value 4 {\displaystyle 4} 4 is 3/16. This is equal to a decimal result of 0.1875.
Reporting Relative Frequency Data
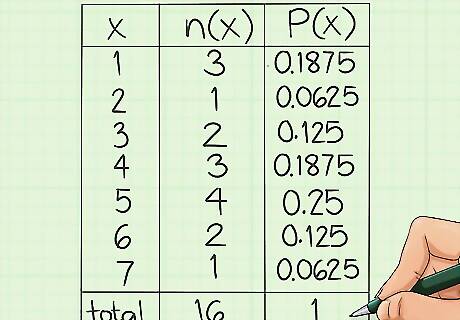
Present your results in a frequency table. The frequency table that you began above can be used to present the results in a format that is easy to review. As you perform each of the calculations, fill in the results in the corresponding places in the table. It is common to round your answers to two decimal places, although you will need to decide this for yourself based on the needs of your study. Because of rounding the end result may total something close to , but not exactly 1.0. For example, using the data set above, the relative frequency table would appear as follows: x : n(x) : P(x) 1 : 3 : 0.19 2 : 1 : 0.06 3 : 2 : 0.13 4 : 3 : 0.19 5 : 4 : 0.25 6 : 2 : 0.13 7 : 1 : 0.06 total : 16 : 1.01
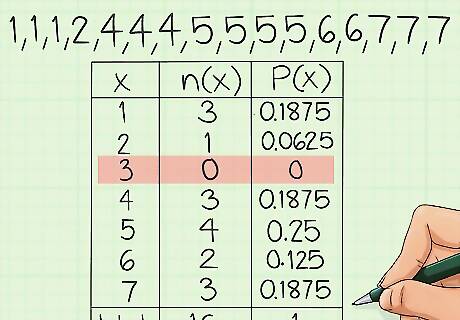
Report items that do not appear. It may be just as meaningful to report items whose frequency is 0 as to report those items that do appear in your data set. Look at the kind of data you are collecting, and if you notice any gaps in your sorted data, you may need to report them as 0s. For example, the sample data set you have been working with includes all values from 1 to 7. But suppose that the number 3 never appeared. That could be important, and you would report the relative frequency of the value 3 as 0.
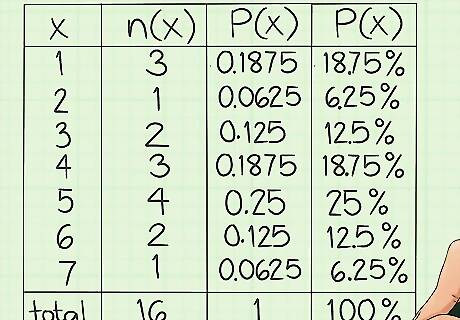
Show your results as percentages. You may wish to turn your decimal results into percentages. This is a common practice, as relative frequency is often used as a predictor of the percentage of times that some value will occur. To convert a decimal number to a percentage, simply shift the decimal point two spaces to the right, and add a percent symbol. For example, the decimal result of 0.13 is equal to 13%. The decimal result of 0.06 is equal to 6%. (Don’t just skip over the 0.)


Comments
0 comment