
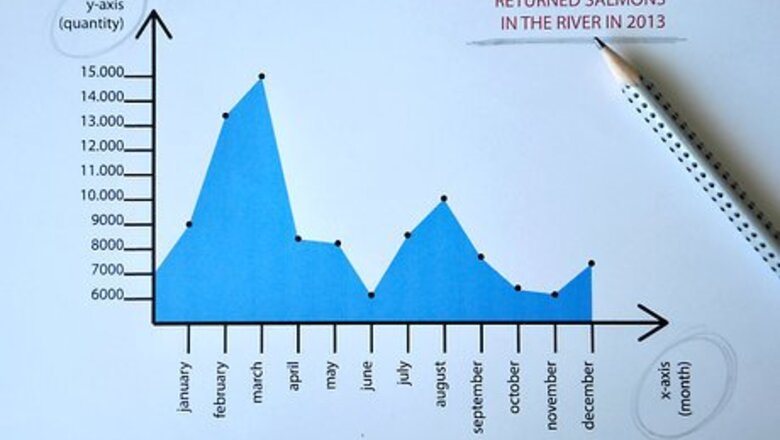
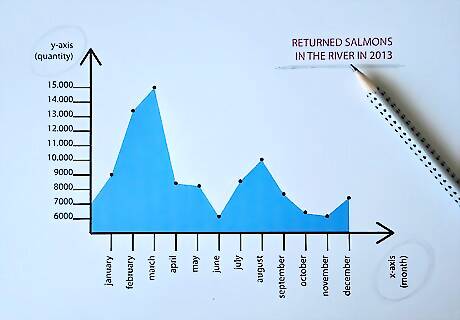
Identify what the graph represents. Most graphs will have a clearly labeled x-element, spaced along the graph's horizontal axis, and a clearly labeled y-element, spaced along the graph's vertical axis. The graph's title should also tell you exactly what it's about.
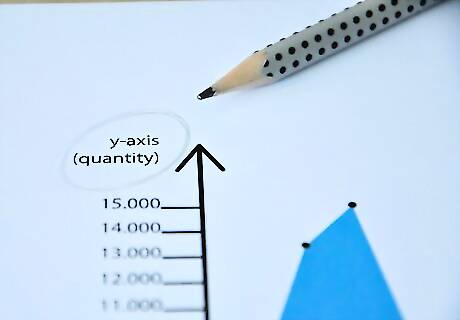
Check the scale for each graph element. This applies to both line graphs and bar graphs. For example, if you're looking at a graph that shows how many salmon returned to a given stream over the period of a few months last year, each increment along the graph's y-axis might represent hundreds, thousands or tens of thousands of salmon returning; you won't know which scale numbers apply until you check the graph.

Locate the graph element you want information on. For example, you might want to know how many salmon returned to the stream in question in August of last year. So you'd read across the graph's horizontal axis until you find "August." Time elements, such as days, weeks, months or years, are almost always listed along the horizontal ("x") axis. Quantity measurements are almost always listed along the vertical ("y") axis.
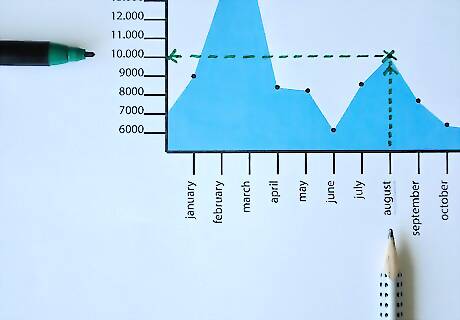
Read directly up from "August" until you find a dot or a slanting line, on a line graph, or the top of a bar for a bar graph. Then read straight across to the left until you hit the graph's labeled y-axis. Whatever quantity that line intersects with is the measurement for salmon return in August. So if you read up to the dot, line or top of the bar for salmon in August then read across to the left and hit "10,000," you know 10,000 salmon returned in August. If you hit a point between any two labeled graph increments, you have to estimate based on where you land between the 2 increments. For example, if you hit a point halfway between 10,000 and 15,000, you can safely estimate that the correct number is about 12,500.


Comments
0 comment