
views
- Save your Excel file as an Excel Workbook in the MATLAB folder to ensure it can be imported correctly.
- Use the command p = plot(indep, dep1, indep, dep2) in the MATLAB command window to create a graph.
- Enter the command grid into the MATLAB command window to add grid lines to your graph.
Importing Excel Data to MATLAB

Open a fresh MATLAB Screen. To make the process of importing and graphing data easier, clear any text in the command window with the command clc.
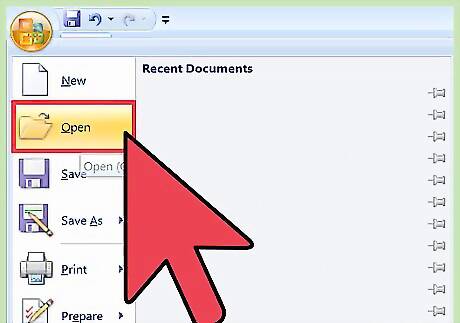
Open your desired Excel file. Be sure to record the name of the Excel file for later use.

Save the Excel file into your MATLAB folder. The pathway for the folder typically is: C:\Users\[your account name]\Documents\MATLAB. Be sure you save the file as an Excel Workbook in order to have the proper file format for the import. Once this step is complete, you should see your Excel file in the current folder section in MATLAB.
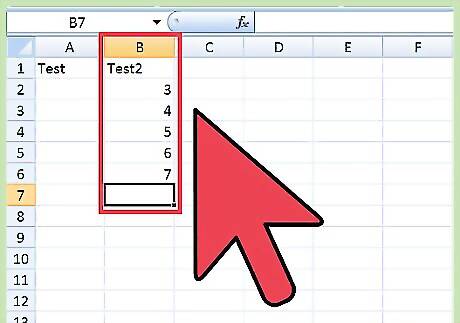
Locate the columns that will be exported. Identify the range of each column to be exported. The range of the column is the first cell in a column to the last cell in a column. The proper format for this range is the first cell followed by a colon followed by the last cell (I.e. “B1:B30”)
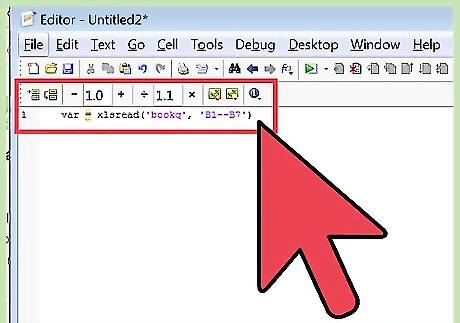
Import the data columns to MATLAB. Enter the command var = xlsread('filename', 'xlrange'); into the command window for each column you want to import. In this command: Var is a variable name of your choice (Example: “x” or “y”) Filename is the name of your excel spreadsheet Xlrange is the range of the desired column in the form “X--:X--“,with X being the letter of the column followed by the cell number.
Customizing Graphs in MATLAB
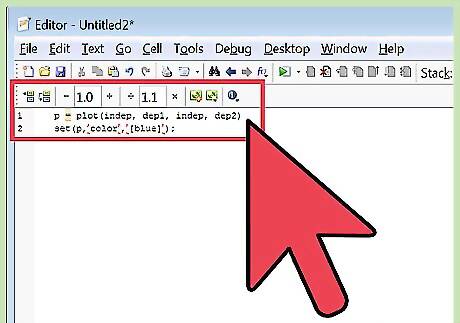
Change the line color. Enter the command set(p,’color’,’[Desired Color]’); into the command window to change all the graphed lines to the same color. In this command, p is a reference to the variable you set your plot equal to in step 6. If you wish to change the color of only one line enter set(p(x),’color’,’[Desired Color]’); into the command line. The x in p(x) is the number that corresponds to the order that the lines are plotted in (Example: y1 = p(1), y2 = p(2)).
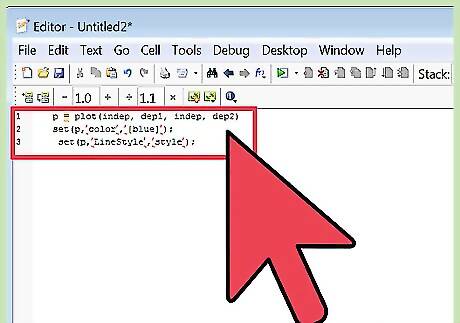
Change the line style. Enter the command set(p,’LineStyle’,’style’); into the command window to change all of the graphed lines to the same style. If you wish to change the style of one line only, enter the command set(p(x),’LineStyle’,’style’); into the command line. In this command, the x in p(x) corresponds to the number in which the lines were graphed (Example: y1 = p(1), y2 = p(2)). Common line styles include: dashed lines= '--' dotted lines = ':' solid line = '-' dash-dot line = '-.'
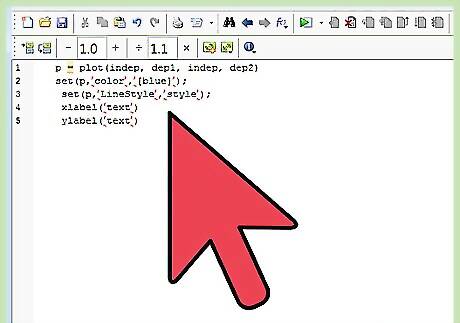
Label your axis. To label the x-axis, enter the command xlabel(‘text’) in the command window. To label the y-axis, enter the command ylabel(‘text’) in the command window.
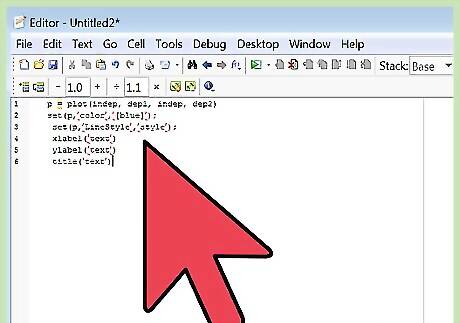
Add a title to your graph. Enter the command title(‘text’) in the command window. The title will display at the top of your graph.
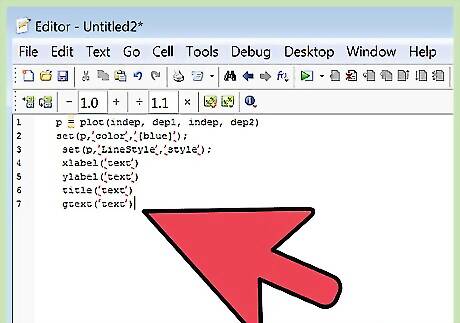
Add text within the graph. If you wish to enter text near your graphed lines, enter the command gtext(‘text’). Once you enter the command, a cursor will appear on the graph allowing you to click the area you wish to apply the label. The label can be put anywhere in the graph space.
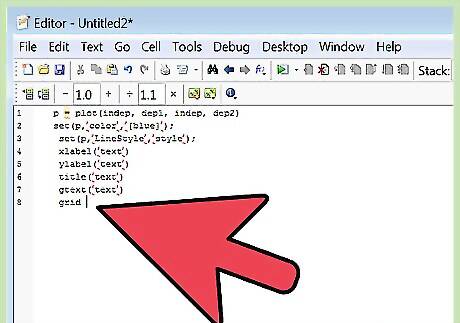
Add grid lines to the graph. If you wish to put grid lines in your plot for easier reading, enter the command grid into the command window. Entering the command again will remove the grid lines.
Save your graph. Click file on upper right hand side of the MATLAB graph screen followed by save as in the menu. Save the graph to the desired location.


Comments
0 comment